Wykrywanie klastrów geograficznych
Mam dane R.ramka zawierająca długość, szerokość geograficzną, która rozciąga się na całej mapie USA. Gdy X liczba wpisów znajdują się w małym regionie geograficznym powiedzmy kilka stopni długości geograficznej i kilka stopni szerokości geograficznej, chcę być w stanie to wykryć, a następnie mój program zwróci Współrzędne dla obwiedni geograficznej. Czy istnieje Pakiet Python lub R CRAN, który już to robi? Jeśli nie, to jak mam ustalić te informacje?
5 answers
Udało mi się połączyć odpowiedź Jorana z komentarzem dana H. To jest przykład:
Kod Pythona emituje funkcje dla R: map () i rect (). Ta przykładowa Mapa USA została stworzona z:
map('state', plot = TRUE, fill = FALSE, col = palette())
A następnie możesz zastosować rect () odpowiednio z with w interpreterze R GUI (patrz poniżej).
import math
from collections import defaultdict

to_rad = math.pi / 180.0   # convert lat or lng to radians
fname = "site.tsv"        # file format: LAT\tLONG
threshhold_dist=50         # adjust to your needs
threshhold_locations=15    # minimum # of locations needed in a cluster

def dist(lat1,lng1,lat2,lng2):
    global to_rad
    earth_radius_km = 6371

    dLat = (lat2-lat1) * to_rad
    dLon = (lng2-lng1) * to_rad
    lat1_rad = lat1 * to_rad
    lat2_rad = lat2 * to_rad

    a = math.sin(dLat/2) * math.sin(dLat/2) + math.sin(dLon/2) * math.sin(dLon/2) * math.cos(lat1_rad) * math.cos(lat2_rad)
    c = 2 * math.atan2(math.sqrt(a), math.sqrt(1-a));
    dist = earth_radius_km * c
    return dist

def bounding_box(src, neighbors):
    neighbors.append(src)
    # nw = NorthWest se=SouthEast
    nw_lat = -360
    nw_lng = 360
    se_lat = 360
    se_lng = -360

    for (y,x) in neighbors:
        if y > nw_lat: nw_lat = y
        if x > se_lng: se_lng = x

        if y < se_lat: se_lat = y
        if x < nw_lng: nw_lng = x

    # add some padding
    pad = 0.5
    nw_lat += pad
    nw_lng -= pad
    se_lat -= pad
    se_lng += pad

    # sutiable for r's map() function
    return (se_lat,nw_lat,nw_lng,se_lng)

def sitesDist(site1,site2):
    #just a helper to shorted list comprehension below
    return dist(site1[0],site1[1], site2[0], site2[1])

def load_site_data():
    global fname
    sites = defaultdict(tuple)

    data = open(fname,encoding="latin-1")
    data.readline() # skip header
    for line in data:
        line = line[:-1]
        slots = line.split("\t")
        lat = float(slots[0])
        lng = float(slots[1])
        lat_rad = lat * math.pi / 180.0
        lng_rad = lng * math.pi / 180.0
        sites[(lat,lng)] = (lat,lng) #(lat_rad,lng_rad)
    return sites

def main():
    sites_dict = {}
    sites = load_site_data()
    for site in sites:
        #for each site put it in a dictionary with its value being an array of neighbors
        sites_dict[site] = [x for x in sites if x != site and sitesDist(site,x) < threshhold_dist]

    results = {}
    for site in sites:
        j = len(sites_dict[site])
        if j >= threshhold_locations:
            coord = bounding_box( site, sites_dict[site] )
            results[coord] = coord

    for bbox in results:
        yx="ylim=c(%s,%s), xlim=c(%s,%s)" % (results[bbox]) #(se_lat,nw_lat,nw_lng,se_lng)
        print('map("county", plot=T, fill=T, col=palette(), %s)' % yx)
        rect='rect(%s,%s, %s,%s, col=c("red"))' % (results[bbox][2], results[bbox][0], results[bbox][3], results[bbox][2])
        print(rect)
        print("")

main()
Oto przykładowy plik TSV (site.tsv)
LAT     LONG
36.3312 -94.1334
36.6828 -121.791
37.2307 -121.96
37.3857 -122.026
37.3857 -122.026
37.3857 -122.026
37.3895 -97.644
37.3992 -122.139
37.3992 -122.139
37.402  -122.078
37.402  -122.078
37.402  -122.078
37.402  -122.078
37.402  -122.078
37.48   -122.144
37.48   -122.144
37.55   126.967
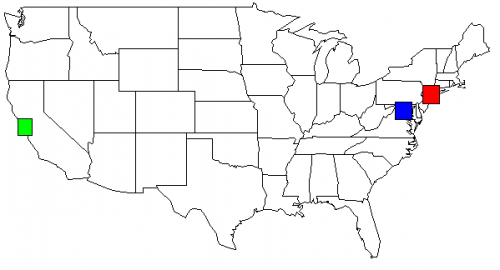
Z moim zestawem danych, wyjście mojego skryptu Pythona, pokazane na mapie USA. Zmieniłem kolory dla jasności.
rect(-74.989,39.7667, -73.0419,41.5209, col=c("red"))
rect(-123.005,36.8144, -121.392,38.3672, col=c("green"))
rect(-78.2422,38.2474, -76.3,39.9282, col=c("blue"))
Dodano 2013-05-01 dla Yacob
Te 2 linie dają ci ponad wszystkie bramki...
map("county", plot=T )
rect(-122.644,36.7307, -121.46,37.98, col=c("red"))
Jeśli chcesz zawęzić część mapy, możesz użyć ylim i xlim
map("county", plot=T, ylim=c(36.7307,37.98), xlim=c(-122.644,-121.46))
# or for more coloring, but choose one or the other map("country") commands
map("county", plot=T, fill=T, col=palette(), ylim=c(36.7307,37.98), xlim=c(-122.644,-121.46))
rect(-122.644,36.7307, -121.46,37.98, col=c("red"))
Będziesz chciał użyć mapy świata...
map("world", plot=T )
Dawno nie używałem tego kodu Pythona, który umieściłem poniżej, więc postaram się jak najlepiej Ci pomóc.
threshhold_dist is the size of the bounding box, ie: the geographical area
theshhold_location is the number of lat/lng points needed with in
    the bounding box in order for it to be considered a cluster.
Oto kompletny przykład. Plik TSV znajduje się na pastebin.com. dodałem również obraz wygenerowany z R, który zawiera wyjście wszystkich poleceń rect ().
# pyclusters.py
# May-02-2013
# -John Taylor

# latlng.tsv is located at http://pastebin.com/cyvEdx3V
# use the "RAW Paste Data" to preserve the tab characters

import math
from collections import defaultdict

# See also: http://www.geomidpoint.com/example.html
# See also: http://www.movable-type.co.uk/scripts/latlong.html

to_rad = math.pi / 180.0  # convert lat or lng to radians
fname = "latlng.tsv"      # file format: LAT\tLONG
threshhold_dist=20        # adjust to your needs
threshhold_locations=20   # minimum # of locations needed in a cluster
earth_radius_km = 6371

def coord2cart(lat,lng):
    x = math.cos(lat) * math.cos(lng)
    y = math.cos(lat) * math.sin(lng)
    z = math.sin(lat)
    return (x,y,z)

def cart2corrd(x,y,z):
    lon = math.atan2(y,x)
    hyp = math.sqrt(x*x + y*y)
    lat = math.atan2(z,hyp)
    return(lat,lng)

def dist(lat1,lng1,lat2,lng2):
    global to_rad, earth_radius_km

    dLat = (lat2-lat1) * to_rad
    dLon = (lng2-lng1) * to_rad
    lat1_rad = lat1 * to_rad
    lat2_rad = lat2 * to_rad

    a = math.sin(dLat/2) * math.sin(dLat/2) + math.sin(dLon/2) * math.sin(dLon/2) * math.cos(lat1_rad) * math.cos(lat2_rad)
    c = 2 * math.atan2(math.sqrt(a), math.sqrt(1-a));
    dist = earth_radius_km * c
    return dist

def bounding_box(src, neighbors):
    neighbors.append(src)
    # nw = NorthWest se=SouthEast
    nw_lat = -360
    nw_lng = 360
    se_lat = 360
    se_lng = -360

    for (y,x) in neighbors:
        if y > nw_lat: nw_lat = y
        if x > se_lng: se_lng = x

        if y < se_lat: se_lat = y
        if x < nw_lng: nw_lng = x

    # add some padding
    pad = 0.5
    nw_lat += pad
    nw_lng -= pad
    se_lat -= pad
    se_lng += pad

    #print("answer:")
    #print("nw lat,lng : %s %s" % (nw_lat,nw_lng))
    #print("se lat,lng : %s %s" % (se_lat,se_lng))

    # sutiable for r's map() function
    return (se_lat,nw_lat,nw_lng,se_lng)

def sitesDist(site1,site2):
    # just a helper to shorted list comprehensioin below
    return dist(site1[0],site1[1], site2[0], site2[1])

def load_site_data():
    global fname
    sites = defaultdict(tuple)

    data = open(fname,encoding="latin-1")
    data.readline() # skip header
    for line in data:
        line = line[:-1]
        slots = line.split("\t")
        lat = float(slots[0])
        lng = float(slots[1])
        lat_rad = lat * math.pi / 180.0
        lng_rad = lng * math.pi / 180.0
        sites[(lat,lng)] = (lat,lng) #(lat_rad,lng_rad)
    return sites

def main():
    color_list = ( "red", "blue", "green", "yellow", "orange", "brown", "pink", "purple" )
    color_idx = 0
    sites_dict = {}
    sites = load_site_data()
    for site in sites:
        #for each site put it in a dictionarry with its value being an array of neighbors
        sites_dict[site] = [x for x in sites if x != site and sitesDist(site,x) < threshhold_dist]

    print("")
    print('map("state", plot=T)') # or use: county instead of state
    print("")


    results = {}
    for site in sites:
        j = len(sites_dict[site])
        if j >= threshhold_locations:
            coord = bounding_box( site, sites_dict[site] )
            results[coord] = coord

    for bbox in results:
        yx="ylim=c(%s,%s), xlim=c(%s,%s)" % (results[bbox]) #(se_lat,nw_lat,nw_lng,se_lng)

        # important!
        # if you want an individual map for each cluster, uncomment this line
        #print('map("county", plot=T, fill=T, col=palette(), %s)' % yx)
        if len(color_list) == color_idx:
            color_idx = 0
        rect='rect(%s,%s, %s,%s, col=c("%s"))' % (results[bbox][2], results[bbox][0], results[bbox][3], results[bbox][1], color_list[color_idx])
        color_idx += 1
        print(rect)
    print("")


main()
Warning: date(): Invalid date.timezone value 'Europe/Kyiv', we selected the timezone 'UTC' for now. in /var/www/agent_stack/data/www/doraprojects.net/template/agent.layouts/content.php on line 54
2013-05-02 15:17:38
Robię to regularnie, najpierw tworząc matrycę odległości, a następnie uruchamiając na niej klastry. Oto Mój kod.
library(geosphere)
library(cluster)
clusteramounts <- 10
distance.matrix <- (distm(points.to.group[,c("lon","lat")]))
clustersx <- as.hclust(agnes(distance.matrix, diss = T))
points.to.group$group <- cutree(clustersx, k=clusteramounts)
Jeśli chcesz, aby X było 20 i masz 18 punktów w Nowym Jorku i 22 W Dallas, musisz zdecydować, czy chcesz jedno małe i jedno naprawdę duże pudełko (20 punktów każdy), czy lepiej mieć pudełko Dallas zawierać 22 punkty, lub jeśli chcesz podzielić 22 punkty w Dallas na dwie grupy. Grupowanie na podstawie odległości może być dobre w niektórych z tych przypadków. Ale to oczywiście zależy od tego, dlaczego chcesz grupować punkty.
/Chris
Warning: date(): Invalid date.timezone value 'Europe/Kyiv', we selected the timezone 'UTC' for now. in /var/www/agent_stack/data/www/doraprojects.net/template/agent.layouts/content.php on line 54
2012-04-12 17:51:28
Kilka pomysłów:
- ad-hoc & approximate: "histogram 2-D". Utwórz dowolne" prostokątne " pojemniki o wybranej szerokości stopni, Przypisz każdemu pojemnikowi ID. Umieszczenie punktu w koszu oznacza "kojarzenie punktu z identyfikatorem kosza". Po każdym dodaniu do kosza zapytaj kosza, ile ma punktów. Minusy: nie "widzi" poprawnie skupiska punktów, które okalają granicę pojemnika; i: pojemniki o "stałej szerokości podłużnej" są w rzeczywistości (przestrzennie) mniejsze w miarę poruszania się północ.
- Użyj Biblioteki "Shapely" dla Pythona. Postępuj zgodnie z jego podstawowym przykładem dla "punktów buforowania" i wykonaj kaskadową kombinację buforów. Poszukaj globusów na określonym obszarze lub które "zawierają" pewną liczbę oryginalnych punktów. Zauważ, że Shapely nie jest z natury "GEO-savy", więc będziesz musiał dodać poprawki, jeśli ich potrzebujesz.
- Użyj true DB z przetwarzaniem przestrzennym. MySQL, Oracle, Postgres (z PostGIS), MSSQL wszystkie (chyba) mają" geometrię "i" geografię " typów danych, a możesz wykonywać na nich zapytania przestrzenne(ze skryptów Pythona).
Każdy z nich ma inne koszty w dolarach i czasie (w krzywej uczenia się)... i różne stopnie dokładności geoprzestrzennej. Musisz wybrać to, co odpowiada Twojemu budżetowi i / lub wymaganiom.
Warning: date(): Invalid date.timezone value 'Europe/Kyiv', we selected the timezone 'UTC' for now. in /var/www/agent_stack/data/www/doraprojects.net/template/agent.layouts/content.php on line 54
2012-04-11 15:22:37
Jeśli używasz shapely, możesz rozszerzyć moją funkcję cluster_points aby zwrócić obwiednię klastra poprzez .właściwość bounds geometrii kształtnej, na przykład tak:
clusterlist.append(cluster, (poly.buffer(-b)).bounds)
Warning: date(): Invalid date.timezone value 'Europe/Kyiv', we selected the timezone 'UTC' for now. in /var/www/agent_stack/data/www/doraprojects.net/template/agent.layouts/content.php on line 54
2015-11-07 18:43:28
Może coś w stylu
def dist(lat1,lon1,lat2,lon2):
    #just return normal x,y dist
    return sqrt((lat1-lat2)**2+(lon1-lon2)**2)

def sitesDist(site1,site2):
    #just a helper to shorted list comprehensioin below
    return dist(site1.lat,site1.lon,site2.lat,site2.lon)
sites_dict = {}
threshhold_dist=5 #example dist
for site in sites:
    #for each site put it in a dictionarry with its value being an array of neighbors
    sites_dict[site] = [x for x in sites if x != site and sitesDist(site,x) < threshhold_dist]
print "\n".join(sites_dict)
Warning: date(): Invalid date.timezone value 'Europe/Kyiv', we selected the timezone 'UTC' for now. in /var/www/agent_stack/data/www/doraprojects.net/template/agent.layouts/content.php on line 54
2012-04-11 14:56:37