Dodać nowy wiersz do dataframe, w określonym wierszu-index, nie dołączony?
Następujący kod łączy wektor z ramką danych:
newrow = c(1:4)
existingDF = rbind(existingDF,newrow)
Jednak ten kod zawsze wstawia nowy wiersz na końcu ramki danych.
Jak mogę wstawić wiersz w określonym punkcie w ramce danych? Na przykład, powiedzmy, że ramka danych ma 20 wierszy, jak mogę wstawić nowy wiersz między wierszami 10 i 11?
4 answers
Oto rozwiązanie, które pozwala uniknąć (często powolnego) rbind wywołania:
existingDF <- as.data.frame(matrix(seq(20),nrow=5,ncol=4))
r <- 3
newrow <- seq(4)
insertRow <- function(existingDF, newrow, r) {
  existingDF[seq(r+1,nrow(existingDF)+1),] <- existingDF[seq(r,nrow(existingDF)),]
  existingDF[r,] <- newrow
  existingDF
}

> insertRow(existingDF, newrow, r)
  V1 V2 V3 V4
1  1  6 11 16
2  2  7 12 17
3  1  2  3  4
4  3  8 13 18
5  4  9 14 19
6  5 10 15 20
Jeśli szybkość jest mniej ważna niż jasność, To rozwiązanie @ Simon działa dobrze:
existingDF <- rbind(existingDF[1:r,],newrow,existingDF[-(1:r),])
> existingDF
   V1 V2 V3 V4
1   1  6 11 16
2   2  7 12 17
3   3  8 13 18
4   1  2  3  4
41  4  9 14 19
5   5 10 15 20
(Uwaga indeksujemy r inaczej).
I na koniec benchmarki:
library(microbenchmark)
microbenchmark(
  rbind(existingDF[1:r,],newrow,existingDF[-(1:r),]),
  insertRow(existingDF,newrow,r)
)

Unit: microseconds
                                                    expr     min       lq   median       uq       max
1                       insertRow(existingDF, newrow, r) 660.131 678.3675 695.5515 725.2775   928.299
2 rbind(existingDF[1:r, ], newrow, existingDF[-(1:r), ]) 801.161 831.7730 854.6320 881.6560 10641.417
Benchmarki
Jak zawsze zwraca mi uwagę @MatthewDowle, benchmarki muszą być zbadane pod kątem skalowania, Ponieważ rozmiar problemu wzrasta. No to zaczynamy:
benchmarkInsertionSolutions <- function(nrow=5,ncol=4) {
  existingDF <- as.data.frame(matrix(seq(nrow*ncol),nrow=nrow,ncol=ncol))
  r <- 3 # Row to insert into
  newrow <- seq(ncol)
  m <- microbenchmark(
   rbind(existingDF[1:r,],newrow,existingDF[-(1:r),]),
   insertRow(existingDF,newrow,r),
   insertRow2(existingDF,newrow,r)
  )
  # Now return the median times
  mediansBy <- by(m$time,m$expr, FUN=median)
  res <- as.numeric(mediansBy)
  names(res) <- names(mediansBy)
  res
}
nrows <- 5*10^(0:5)
benchmarks <- sapply(nrows,benchmarkInsertionSolutions)
colnames(benchmarks) <- as.character(nrows)
ggplot( melt(benchmarks), aes(x=Var2,y=value,colour=Var1) ) + geom_line() + scale_x_log10() + scale_y_log10()
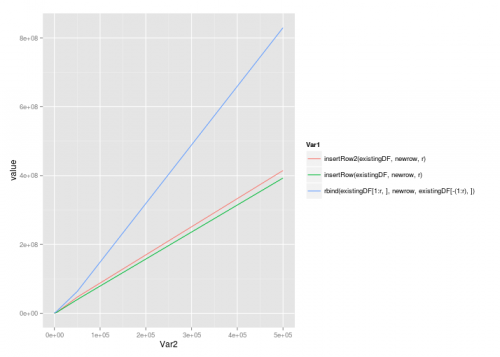
@Roland ' s solution skaluje całkiem no, nawet z wywołaniem do rbind:
                                                              5       50     500    5000    50000     5e+05
insertRow2(existingDF, newrow, r)                      549861.5 579579.0  789452 2512926 46994560 414790214
insertRow(existingDF, newrow, r)                       895401.0 905318.5 1168201 2603926 39765358 392904851
rbind(existingDF[1:r, ], newrow, existingDF[-(1:r), ]) 787218.0 814979.0 1263886 5591880 63351247 829650894
Wykreślone w skali liniowej:
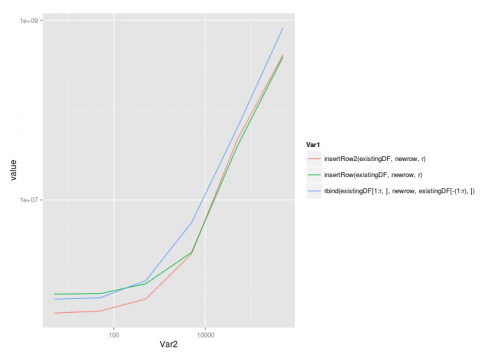
I skala log-log:
Warning: date(): Invalid date.timezone value 'Europe/Kyiv', we selected the timezone 'UTC' for now. in /var/www/agent_stack/data/www/doraprojects.net/template/agent.layouts/content.php on line 54
2013-04-17 10:24:57
insertRow2 <- function(existingDF, newrow, r) {
  existingDF <- rbind(existingDF,newrow)
  existingDF <- existingDF[order(c(1:(nrow(existingDF)-1),r-0.5)),]
  row.names(existingDF) <- 1:nrow(existingDF)
  return(existingDF)
}

insertRow2(existingDF,newrow,r)

  V1 V2 V3 V4
1  1  6 11 16
2  2  7 12 17
3  1  2  3  4
4  3  8 13 18
5  4  9 14 19
6  5 10 15 20

microbenchmark(
+   rbind(existingDF[1:r,],newrow,existingDF[-(1:r),]),
+   insertRow(existingDF,newrow,r),
+   insertRow2(existingDF,newrow,r)
+ )
Unit: microseconds
                                                    expr     min       lq   median       uq      max
1                       insertRow(existingDF, newrow, r) 513.157 525.6730 531.8715 544.4575 1409.553
2                      insertRow2(existingDF, newrow, r) 430.664 443.9010 450.0570 461.3415  499.988
3 rbind(existingDF[1:r, ], newrow, existingDF[-(1:r), ]) 606.822 625.2485 633.3710 653.1500 1489.216
Warning: date(): Invalid date.timezone value 'Europe/Kyiv', we selected the timezone 'UTC' for now. in /var/www/agent_stack/data/www/doraprojects.net/template/agent.layouts/content.php on line 54
2012-07-20 21:17:47
Powinieneś wypróbować pakiet dplyr
library(dplyr)
a <- data.frame(A = c(1, 2, 3, 4),
               B = c(11, 12, 13, 14))


system.time({
for (i in 50:1000) {
    b <- data.frame(A = i, B = i * i)
    a <- bind_rows(a, b)
}

})
Wyjście
   user  system elapsed
   0.25    0.00    0.25
W przeciwieństwie do używania funkcji rbind
a <- data.frame(A = c(1, 2, 3, 4),
                B = c(11, 12, 13, 14))


system.time({
    for (i in 50:1000) {
        b <- data.frame(A = i, B = i * i)
        a <- rbind(a, b)
    }

})
Wyjście
   user  system elapsed
   0.49    0.00    0.49
Jest pewien wzrost wydajności.
Warning: date(): Invalid date.timezone value 'Europe/Kyiv', we selected the timezone 'UTC' for now. in /var/www/agent_stack/data/www/doraprojects.net/template/agent.layouts/content.php on line 54
2015-12-12 13:55:22
Na przykład chcesz dodać wiersze zmiennej 2 do zmiennej 1 danych o nazwie " krawędzie" po prostu zrób to tak
allEdges <- data.frame(c(edges$V1,edges$V2))
Warning: date(): Invalid date.timezone value 'Europe/Kyiv', we selected the timezone 'UTC' for now. in /var/www/agent_stack/data/www/doraprojects.net/template/agent.layouts/content.php on line 54
2015-04-28 00:21:01