filtr kalman 2d w Pythonie
Moje wejście to 2D (x,y) szereg czasowy kropki poruszającej się po ekranie dla oprogramowania trackera. Ma pewne szumy, które chcę usunąć za pomocą filtra Kalmana. Czy ktoś może mi wskazać kod Pythona do filtra Kalman 2d? W książce kucharskiej scipy znalazłem tylko przykład 1d: http://www.scipy.org/Cookbook/KalmanFiltering Widziałem, że w OpenCV jest implementacja filtra Kalmana, ale nie mogłem znaleźć przykładów kodu. Dzięki!
1 answers
Oto moja implementacja filtra Kalmana na podstawie równań podanych na Wikipedii . Proszę pamiętać, że moje zrozumienie filtrów Kalmana jest bardzo prymitywne, więc istnieją najprawdopodobniej sposoby ulepszenia tego kodu. (Na przykład, cierpi na problem niestabilności numerycznej omawiany tutaj . Jak rozumiem, wpływa to na stabilność liczbową tylko wtedy, gdy Q, szum ruchu, jest bardzo mały. W prawdziwym życiu hałas zwykle nie jest mały, więc na szczęście (przynajmniej dla mojej realizacji) w praktyce niestabilność numeryczna się nie ujawnia.)
W poniższym przykładzie kalman_xy zakłada, że wektor stanu jest krotką 4: 2 liczby dla położenia i 2 liczby dla prędkości.
Macierze F i H zostały zdefiniowane specjalnie dla tego wektora stanu: Jeśli x jest stanem 4-krotnym, to
new_x = F * x
position = H * x
Następnie wywołuje kalman, który jest uogólnionym filtrem Kalmana. Jest ogólny w tym sensie, że nadal jest przydatny, jeśli chcesz zdefiniować inny wektor stanu. być może sześciokrotka reprezentująca położenie, prędkość i przyspieszenie. Wystarczy zdefiniować równania ruchu poprzez podanie odpowiednich F i H.
import numpy as np
import matplotlib.pyplot as plt

def kalman_xy(x, P, measurement, R,
              motion = np.matrix('0. 0. 0. 0.').T,
              Q = np.matrix(np.eye(4))):
    """
    Parameters:
    x: initial state 4-tuple of location and velocity: (x0, x1, x0_dot, x1_dot)
    P: initial uncertainty convariance matrix
    measurement: observed position
    R: measurement noise
    motion: external motion added to state vector x
    Q: motion noise (same shape as P)
    """
    return kalman(x, P, measurement, R, motion, Q,
                  F = np.matrix('''
                      1. 0. 1. 0.;
                      0. 1. 0. 1.;
                      0. 0. 1. 0.;
                      0. 0. 0. 1.
                      '''),
                  H = np.matrix('''
                      1. 0. 0. 0.;
                      0. 1. 0. 0.'''))

def kalman(x, P, measurement, R, motion, Q, F, H):
    '''
    Parameters:
    x: initial state
    P: initial uncertainty convariance matrix
    measurement: observed position (same shape as H*x)
    R: measurement noise (same shape as H)
    motion: external motion added to state vector x
    Q: motion noise (same shape as P)
    F: next state function: x_prime = F*x
    H: measurement function: position = H*x

    Return: the updated and predicted new values for (x, P)

    See also http://en.wikipedia.org/wiki/Kalman_filter

    This version of kalman can be applied to many different situations by
    appropriately defining F and H
    '''
    # UPDATE x, P based on measurement m
    # distance between measured and current position-belief
    y = np.matrix(measurement).T - H * x
    S = H * P * H.T + R  # residual convariance
    K = P * H.T * S.I    # Kalman gain
    x = x + K*y
    I = np.matrix(np.eye(F.shape[0])) # identity matrix
    P = (I - K*H)*P

    # PREDICT x, P based on motion
    x = F*x + motion
    P = F*P*F.T + Q

    return x, P

def demo_kalman_xy():
    x = np.matrix('0. 0. 0. 0.').T
    P = np.matrix(np.eye(4))*1000 # initial uncertainty

    N = 20
    true_x = np.linspace(0.0, 10.0, N)
    true_y = true_x**2
    observed_x = true_x + 0.05*np.random.random(N)*true_x
    observed_y = true_y + 0.05*np.random.random(N)*true_y
    plt.plot(observed_x, observed_y, 'ro')
    result = []
    R = 0.01**2
    for meas in zip(observed_x, observed_y):
        x, P = kalman_xy(x, P, meas, R)
        result.append((x[:2]).tolist())
    kalman_x, kalman_y = zip(*result)
    plt.plot(kalman_x, kalman_y, 'g-')
    plt.show()

demo_kalman_xy()
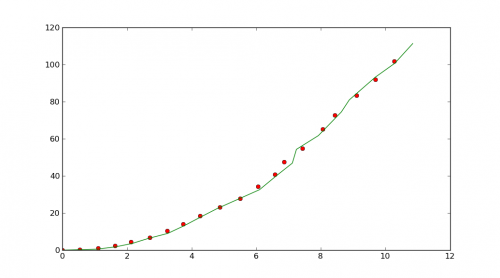
Czerwone kropki pokazują głośne pomiary pozycji, zielona linia pokazuje przewidywane pozycje Kalmana.
Warning: date(): Invalid date.timezone value 'Europe/Kyiv', we selected the timezone 'UTC' for now. in /var/www/agent_stack/data/www/doraprojects.net/template/agent.layouts/content.php on line 54
2012-12-17 00:27:02