Przypisywanie tytułu aspektu jako paska nad aspektem
Chcę dodać tytuł aspektu jako pasek nad wykresem w ggplot2. Mój MWE wyrzuca błąd. Każda pomoc będzie bardzo mile widziana. Dzięki
library(ggplot2)
library(gtable)
p <- ggplot(mtcars, aes(mpg, wt)) + geom_point()
p <- p + facet_grid(. ~ cyl)


# get gtable object
Plot1 <- ggplot_gtable(ggplot_build(p))
# add label for top strip
Plot1 <- gtable_add_rows(Plot1, Plot1$heights[[3]], 2)
Plot1 <- gtable_add_grob(Plot1,
  list(rectGrob(gp = gpar(col = NA, fill = gray(0.5))),
  textGrob("Cyl", gp = gpar(col = gray(1)))),
  3, 4, 3, 10, name = paste(runif(2)))

# add margins
Plot1 <- gtable_add_rows(Plot1, unit(1/8, "line"), 2)

# draw it
grid.newpage()
print(grid.draw(Plot1))
11
Author: Sandy Muspratt, 2014-04-02
1 answers
Edycja Aktualizacja do wersji ggplot 3.0.0
Myślę, że byliście blisko. Numery wierszy i kolumn były błędne w poleceniu dodaj grob. Twój nowy pasek obejmuje kolumny od 5 do 9; to znaczy Zmień 10 na 9 w Komendzie dodaj grob.library(ggplot2)
library(gtable)
library(grid)
p <- ggplot(mtcars, aes(mpg, wt)) + geom_point()
p <- p + facet_grid(. ~ cyl)
z <- ggplotGrob(p)
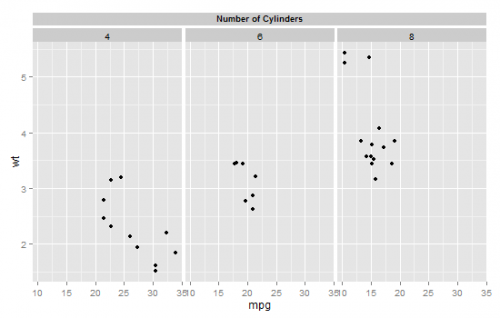
# New strip at the top
z <- gtable_add_rows(z, z$height[7], pos = 6) # New row added below row 6
# Check the layout
gtable_show_layout(z) # New strip goes into row 7
# New strip spans columns 5 to 9
z <- gtable_add_grob(z,
list(rectGrob(gp = gpar(col = NA, fill = "gray85", size = .5)),
textGrob("Number of Cylinders", gp = gpar(cex = .75, fontface = 'bold', col = "black"))),
t=7, l=5, b=7, r=9, name = c("a", "b"))
# Add small gap between strips - below row 6
z <- gtable_add_rows(z, unit(2/10, "line"), 7)
# Draw it
grid.newpage()
grid.draw(z)
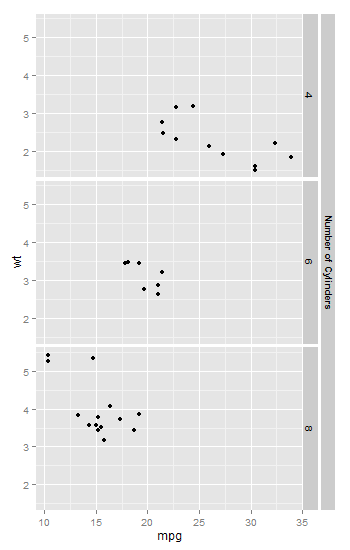
Lub, aby dodać nowy pasek po prawej stronie:
library(ggplot2)
library(gtable)
library(grid)

p <- ggplot(mtcars, aes(mpg, wt)) + geom_point()
p <- p + facet_grid(cyl ~ .)

z <- ggplotGrob(p)

#  New strip to the right
z <- gtable_add_cols(z, z$widths[6], pos = 6)  # New column added to the right of column 6

# Check the layout
gtable_show_layout(z)   # New strip goes into column 7
                        # New strip spans rows 7 to 11
z <- gtable_add_grob(z,
  list(rectGrob(gp = gpar(col = NA, fill = "gray85", size = .5)),
       textGrob("Number of Cylinders", rot = -90,
          gp = gpar(cex = .75, fontface = 'bold', col = "black"))),
  t=7, l=7, b=11, r=7, name = c("a", "b"))

# Add small gap between strips - to the right of column 6
z <- gtable_add_cols(z, unit(2/10, "line"), 6)

# Draw it
grid.newpage()
grid.draw(z)
14
Author: Sandy Muspratt,
Warning: date(): Invalid date.timezone value 'Europe/Kyiv', we selected the timezone 'UTC' for now. in /var/www/agent_stack/data/www/doraprojects.net/template/agent.layouts/content.php on line 54
2018-07-23 21:59:36
Warning: date(): Invalid date.timezone value 'Europe/Kyiv', we selected the timezone 'UTC' for now. in /var/www/agent_stack/data/www/doraprojects.net/template/agent.layouts/content.php on line 54
2018-07-23 21:59:36