Wykres igrafowy z macierzy numpy lub pandy
Mam macierz adjacencyjną zapisaną jako pandas.DataFrame:
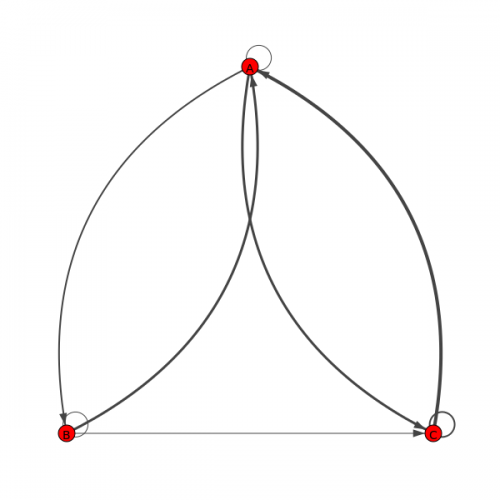
node_names = ['A', 'B', 'C']
a = pd.DataFrame([[1,2,3],[3,1,1],[4,0,2]],
    index=node_names, columns=node_names)
a_numpy = a.as_matrix()
Chciałbym utworzyć igraph.Graph z macierzy pandas lub numpy. W idealnym świecie węzły byłyby nazwane zgodnie z oczekiwaniami.
2 answers
W igraph możesz użyć igraph.Graph.Adjacency aby utworzyć Wykres z macierzy adjacency bez konieczności używania zip. Jest kilka rzeczy, które należy pamiętać, gdy ważona macierz przylegająca jest używana i przechowywana w np.array lub pd.DataFrame.
igraph.Graph.Adjacencynie można przyjąćnp.arrayjako argumentu, ale można to łatwo rozwiązać za pomocątolist.Liczby całkowite w macierzy adjacency-są interpretowane jako liczba krawędzi między węzłami, a nie wagi, rozwiązywane za pomocą adjacency jako boolean.
Przykład jak to zrobić:
import igraph
import pandas as pd

node_names = ['A', 'B', 'C']
a = pd.DataFrame([[1,2,3],[3,1,1],[4,0,2]], index=node_names, columns=node_names)

# Get the values as np.array, it's more convenenient.
A = a.values

# Create graph, A.astype(bool).tolist() or (A / A).tolist() can also be used.
g = igraph.Graph.Adjacency((A > 0).tolist())

# Add edge weights and node labels.
g.es['weight'] = A[A.nonzero()]
g.vs['label'] = node_names  # or a.index/a.columns
Możesz zrekonstruować ramkę danych przy użyciu get_adjacency autor:
df_from_g = pd.DataFrame(g.get_adjacency(attribute='weight').data,
                         columns=g.vs['label'], index=g.vs['label'])
(df_from_g == a).all().all()  # --> True
Warning: date(): Invalid date.timezone value 'Europe/Kyiv', we selected the timezone 'UTC' for now. in /var/www/agent_stack/data/www/doraprojects.net/template/agent.layouts/content.php on line 54
2015-04-16 11:21:46
Ściśle mówiąc, macierz adjacency jest logiczna, z 1 wskazującym na obecność połączenia i 0 wskazującym na brak. Ponieważ wiele wartości w Twojej macierzy a_numpy jest > 1, zakładam, że odpowiadają wagom krawędzi w Twoim wykresie.
import igraph

# get the row, col indices of the non-zero elements in your adjacency matrix
conn_indices = np.where(a_numpy)

# get the weights corresponding to these indices
weights = a_numpy[conn_indices]

# a sequence of (i, j) tuples, each corresponding to an edge from i -> j
edges = zip(*conn_indices)

# initialize the graph from the edge sequence
G = igraph.Graph(edges=edges, directed=True)

# assign node names and weights to be attributes of the vertices and edges
# respectively
G.vs['label'] = node_names
G.es['weight'] = weights

# I will also assign the weights to the 'width' attribute of the edges. this
# means that igraph.plot will set the line thicknesses according to the edge
# weights
G.es['width'] = weights

# plot the graph, just for fun
igraph.plot(G, layout="rt", labels=True, margin=80)
Warning: date(): Invalid date.timezone value 'Europe/Kyiv', we selected the timezone 'UTC' for now. in /var/www/agent_stack/data/www/doraprojects.net/template/agent.layouts/content.php on line 54
2015-04-15 19:13:46