Pozycjonowanie tekstu geom na wykrojniku
Starałem się, aby tytuł był oczywisty, ale tutaj idzie-najpierw data:
dtf <- structure(list(variable = structure(c(1L, 1L, 2L, 2L, 3L, 3L,
4L, 4L, 5L, 5L), .Label = c("vma", "vla", "ia", "fma", "fla"), class = "factor"),
    ustanova = structure(c(1L, 2L, 1L, 2L, 1L, 2L, 1L, 2L, 1L,
    2L), .Label = c("srednja škola", "fakultet"), class = "factor"),
    `(all)` = c(42.9542857142857, 38.7803203661327, 37.8996138996139,
    33.7672811059908, 29.591439688716, 26.1890660592255, 27.9557692307692,
    23.9426605504587, 33.2200772200772, 26.9493087557604)), .Names = c("variable",
"ustanova", "(all)"), row.names = c(NA, 10L), class = c("cast_df",
"data.frame"), idvars = c("variable", "ustanova"), rdimnames = list(
    structure(list(variable = structure(c(1L, 1L, 2L, 2L, 3L,
    3L, 4L, 4L, 5L, 5L), .Label = c("vma", "vla", "ia", "fma",
    "fla"), class = "factor"), ustanova = structure(c(1L, 2L,
    1L, 2L, 1L, 2L, 1L, 2L, 1L, 2L), .Label = c("srednja škola",
    "fakultet"), class = "factor")), .Names = c("variable", "ustanova"
    ), row.names = c("vma_srednja škola", "vma_fakultet", "vla_srednja škola",
    "vla_fakultet", "ia_srednja škola", "ia_fakultet", "fma_srednja škola",
    "fma_fakultet", "fla_srednja škola", "fla_fakultet"), class = "data.frame"),
    structure(list(value = structure(1L, .Label = "(all)", class = "factor")), .Names = "value", row.names = "(all)", class = "data.frame")))
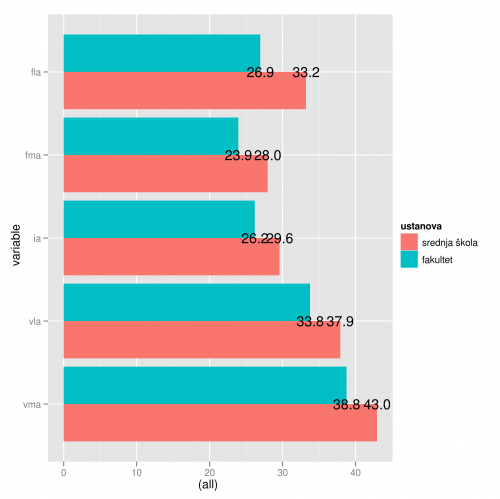
I Chciałbym stworzyć unikalny barplot, zrobić coord_flip i umieścić kilka etykiet tekstowych wewnątrz pasków:
ggplot(bar) + geom_bar(aes(variable, `(all)`, fill = ustanova), position = "dodge") +
 geom_text(aes(variable, `(all)`, label = sprintf("%2.1f", `(all)`)), position = "dodge") +
 coord_flip()
Możesz zobaczyć wyjście tutaj .
106
1 answers
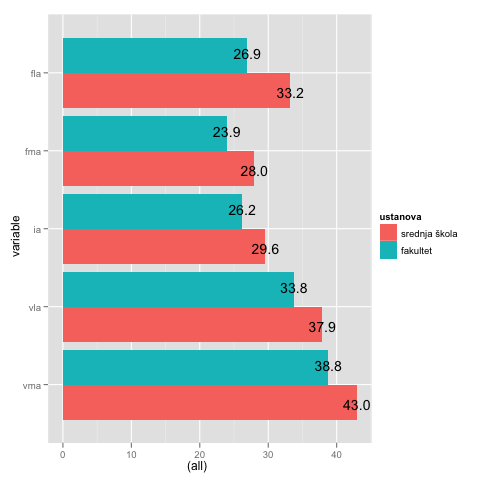
Tego chcesz?
ggplot(bar) +
  geom_bar(aes(variable, `(all)`, fill = ustanova), position = "dodge") +
  geom_text(aes(variable, `(all)`, label = sprintf("%2.1f", `(all)`)),
            position = position_dodge(width = 1)) +
  coord_flip()
Klawisz używa position = position_dodge(width = 1) zamiast position = "dodge", który jest tylko skrótem bez żadnego parametru.
W ggplot2_2.0.0 znajdziesz kilka przykładów w ?geom_text, Jak ustawić geom_text na unikniętych lub ułożonych słupkach (fragment kodu o nazwie "# Aligning labels and bars"). Q & A Co to jest argument width w position_dodge? zapewnia dokładniejszy opis tematu.
171
Author: kohske,
Warning: date(): Invalid date.timezone value 'Europe/Kyiv', we selected the timezone 'UTC' for now. in /var/www/agent_stack/data/www/doraprojects.net/template/agent.layouts/content.php on line 54
2017-05-23 12:18:22
Warning: date(): Invalid date.timezone value 'Europe/Kyiv', we selected the timezone 'UTC' for now. in /var/www/agent_stack/data/www/doraprojects.net/template/agent.layouts/content.php on line 54
2017-05-23 12:18:22