Jak wyodrębnić dowolny wiersz wartości z tablicy numpy?
Mam tablicę numpy, która zawiera dane obrazu. Chciałbym narysować "profil" transektu narysowanego na obrazie. Najprostszym przypadkiem jest profil biegnący równolegle do krawędzi obrazu, więc jeśli tablica obrazu to imdat, to profil w wybranym punkcie (r,c) to po prostu imdat[r] (poziomy) lub imdat[:,c] (pionowy).
Teraz chcę wziąć jako wejście dwa punkty (r1,c1) i (r2,c2), oba leżące wewnątrz imdat. Chciałbym wykreślić profil wartości wzdłuż linii łączącej te dwa punkty.
Jaki jest najlepszy sposób na uzyskanie wartości z tablicy numpy, wzdłuż takiej linii? Ogólniej, wzdłuż ścieżki/wielokąta?
Używałem już krojenia i indeksowania, ale nie mogę znaleźć eleganckiego rozwiązania dla takiego, w którym kolejne elementy krojenia nie są w tym samym wierszu lub kolumnie. Dzięki za pomoc.
5 answers
@ Sven odpowiedź jest łatwa, ale jest raczej nieefektywna dla dużych tablic. Jeśli masz do czynienia ze stosunkowo małą tablicą, nie zauważysz różnicy, jeśli chcesz profil z dużej (np. >50 MB) możesz spróbować kilku innych podejść. Musisz jednak pracować w współrzędnych "pikselowych" dla nich, więc istnieje dodatkowa warstwa złożoności.
Są dwa bardziej efektywne sposoby pamięci. 1) Użycie scipy.ndimage.map_coordinates jeśli potrzebujesz interpolacji dwuliniowej lub sześciennej. 2) jeśli chcesz tylko próbki najbliższego sąsiada, po prostu użyj indeksowania bezpośrednio.
Jako przykład pierwszego:
import numpy as np
import scipy.ndimage
import matplotlib.pyplot as plt

#-- Generate some data...
x, y = np.mgrid[-5:5:0.1, -5:5:0.1]
z = np.sqrt(x**2 + y**2) + np.sin(x**2 + y**2)

#-- Extract the line...
# Make a line with "num" points...
x0, y0 = 5, 4.5 # These are in _pixel_ coordinates!!
x1, y1 = 60, 75
num = 1000
x, y = np.linspace(x0, x1, num), np.linspace(y0, y1, num)

# Extract the values along the line, using cubic interpolation
zi = scipy.ndimage.map_coordinates(z, np.vstack((x,y)))

#-- Plot...
fig, axes = plt.subplots(nrows=2)
axes[0].imshow(z)
axes[0].plot([x0, x1], [y0, y1], 'ro-')
axes[0].axis('image')

axes[1].plot(zi)

plt.show()

Odpowiednik z interpolacją najbliższego sąsiada wyglądałby mniej więcej tak:
import numpy as np
import matplotlib.pyplot as plt

#-- Generate some data...
x, y = np.mgrid[-5:5:0.1, -5:5:0.1]
z = np.sqrt(x**2 + y**2) + np.sin(x**2 + y**2)

#-- Extract the line...
# Make a line with "num" points...
x0, y0 = 5, 4.5 # These are in _pixel_ coordinates!!
x1, y1 = 60, 75
num = 1000
x, y = np.linspace(x0, x1, num), np.linspace(y0, y1, num)

# Extract the values along the line
zi = z[x.astype(np.int), y.astype(np.int)]

#-- Plot...
fig, axes = plt.subplots(nrows=2)
axes[0].imshow(z)
axes[0].plot([x0, x1], [y0, y1], 'ro-')
axes[0].axis('image')

axes[1].plot(zi)

plt.show()
Jednak, jeśli używasz nearest-neighbor, prawdopodobnie chcesz tylko próbki w każdym pikselu, więc prawdopodobnie zrobisz coś więcej, zamiast tego...
import numpy as np
import matplotlib.pyplot as plt

#-- Generate some data...
x, y = np.mgrid[-5:5:0.1, -5:5:0.1]
z = np.sqrt(x**2 + y**2) + np.sin(x**2 + y**2)

#-- Extract the line...
# Make a line with "num" points...
x0, y0 = 5, 4.5 # These are in _pixel_ coordinates!!
x1, y1 = 60, 75
length = int(np.hypot(x1-x0, y1-y0))
x, y = np.linspace(x0, x1, length), np.linspace(y0, y1, length)

# Extract the values along the line
zi = z[x.astype(np.int), y.astype(np.int)]

#-- Plot...
fig, axes = plt.subplots(nrows=2)
axes[0].imshow(z)
axes[0].plot([x0, x1], [y0, y1], 'ro-')
axes[0].axis('image')

axes[1].plot(zi)

plt.show()
Warning: date(): Invalid date.timezone value 'Europe/Kyiv', we selected the timezone 'UTC' for now. in /var/www/agent_stack/data/www/doraprojects.net/template/agent.layouts/content.php on line 54
2011-10-24 19:19:47
Prawdopodobnie najprostszym sposobem na to jest użycie scipy.interpolate.interp2d():
# construct interpolation function
# (assuming your data is in the 2-d array "data")
x = numpy.arange(data.shape[1])
y = numpy.arange(data.shape[0])
f = scipy.interpolate.interp2d(x, y, data)

# extract values on line from r1, c1 to r2, c2
num_points = 100
xvalues = numpy.linspace(c1, c2, num_points)
yvalues = numpy.linspace(r1, r2, num_points)
zvalues = f(xvalues, yvalues)
Warning: date(): Invalid date.timezone value 'Europe/Kyiv', we selected the timezone 'UTC' for now. in /var/www/agent_stack/data/www/doraprojects.net/template/agent.layouts/content.php on line 54
2011-10-24 17:02:51
Testowałem powyższe procedury z obrazami galaktyki i myślę, że znalazłem mały błąd. Myślę, że do świetnego rozwiązania dostarczonego przez Joe należy dodać transpozycję. Oto nieco zmodyfikowana wersja jego kodu, która ujawnia błąd. Jeśli uruchomisz go bez transpozycji, zobaczysz, że profil nie pasuje; z transpozycją wygląda dobrze. Nie jest to widoczne w rozwiązaniu Joego, ponieważ używa symetrycznego obrazu.
import numpy as np
import scipy.ndimage
import matplotlib.pyplot as plt
import scipy.misc # ADDED THIS LINE

#-- Generate some data...
x, y = np.mgrid[-5:5:0.1, -5:5:0.1]
z = np.sqrt(x**2 + y**2) + np.sin(x**2 + y**2)
lena = scipy.misc.lena()  # ADDED THIS ASYMMETRIC IMAGE
z = lena[320:420,330:430] # ADDED THIS ASYMMETRIC IMAGE

#-- Extract the line...
# Make a line with "num" points...
x0, y0 = 5, 4.5 # These are in _pixel_ coordinates!!
x1, y1 = 60, 75
num = 500
x, y = np.linspace(x0, x1, num), np.linspace(y0, y1, num)

# Extract the values along the line, using cubic interpolation
zi = scipy.ndimage.map_coordinates(z, np.vstack((x,y))) # THIS DOESN'T WORK CORRECTLY
zi = scipy.ndimage.map_coordinates(np.transpose(z), np.vstack((x,y))) # THIS SEEMS TO WORK CORRECTLY

#-- Plot...
fig, axes = plt.subplots(nrows=2)
axes[0].imshow(z)
axes[0].plot([x0, x1], [y0, y1], 'ro-')
axes[0].axis('image')

axes[1].plot(zi)

plt.show()
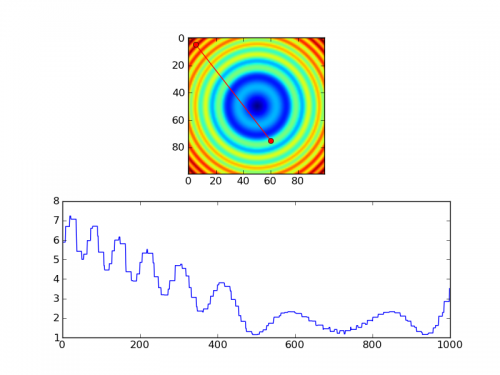
Oto wersja bez transpozycji. Zauważ, że tylko niewielka część po lewej stronie powinna być jasna zgodnie z obrazem, ale fabuła pokazuje prawie połowę działki jako jasną.
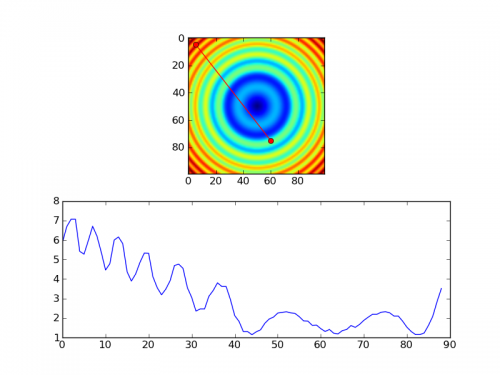
Oto wersja z transpozycją. Na tym obrazie fabuła wydaje się dobrze pasować do tego, czego można oczekiwać od czerwonej linii na obrazie.

Warning: date(): Invalid date.timezone value 'Europe/Kyiv', we selected the timezone 'UTC' for now. in /var/www/agent_stack/data/www/doraprojects.net/template/agent.layouts/content.php on line 54
2014-05-25 00:16:49
Dla roztworu w puszkach zajrzyj do scikit-image ' s measure.profile_line Funkcja.
Jest zbudowany na podstawie scipy.ndimage.map_coordinates jak w @Joe 's answer i ma kilka dodatkowych przydatnych funkcjonalności.
Warning: date(): Invalid date.timezone value 'Europe/Kyiv', we selected the timezone 'UTC' for now. in /var/www/agent_stack/data/www/doraprojects.net/template/agent.layouts/content.php on line 54
2017-05-23 12:18:28
Łącząc tę odpowiedź z przykładem obsługi zdarzeń w dokumentacji MPL , Oto kod umożliwiający przeciąganie / aktualizowanie plasterka w oparciu o GUI, przeciągając dane wykresu (jest to kodowane dla Wykresów pcolormesh):
import numpy as np
import matplotlib.pyplot as plt

# Handle mouse clicks on the plot:
class LineSlice:
    '''Allow user to drag a line on a pcolor/pcolormesh plot, and plot the Z values from that line on a separate axis.

    Example
    -------
    fig, (ax1, ax2) = plt.subplots( nrows=2 )    # one figure, two axes
    img = ax1.pcolormesh( x, y, Z )     # pcolormesh on the 1st axis
    lntr = LineSlice( img, ax2 )        # Connect the handler, plot LineSlice onto 2nd axis

    Arguments
    ---------
    img: the pcolormesh plot to extract data from and that the User's clicks will be recorded for.
    ax2: the axis on which to plot the data values from the dragged line.


    '''
    def __init__(self, img, ax):
        '''
        img: the pcolormesh instance to get data from/that user should click on
        ax: the axis to plot the line slice on
        '''
        self.img = img
        self.ax = ax
        self.data = img.get_array().reshape(img._meshWidth, img._meshHeight)

        # register the event handlers:
        self.cidclick = img.figure.canvas.mpl_connect('button_press_event', self)
        self.cidrelease = img.figure.canvas.mpl_connect('button_release_event', self)

        self.markers, self.arrow = None, None   # the lineslice indicators on the pcolormesh plot
        self.line = None    # the lineslice values plotted in a line
    #end __init__

    def __call__(self, event):
        '''Matplotlib will run this function whenever the user triggers an event on our figure'''
        if event.inaxes != self.img.axes: return     # exit if clicks weren't within the `img` axes
        if self.img.figure.canvas.manager.toolbar._active is not None: return   # exit if pyplot toolbar (zooming etc.) is active

        if event.name == 'button_press_event':
            self.p1 = (event.xdata, event.ydata)    # save 1st point
        elif event.name == 'button_release_event':
            self.p2 = (event.xdata, event.ydata)    # save 2nd point
            self.drawLineSlice()    # draw the Line Slice position & data
    #end __call__

    def drawLineSlice( self ):
        ''' Draw the region along which the Line Slice will be extracted, onto the original self.img pcolormesh plot.  Also update the self.axis plot to show the line slice data.'''
        '''Uses code from these hints:
        http://stackoverflow.com/questions/7878398/how-to-extract-an-arbitrary-line-of-values-from-a-numpy-array
        http://stackoverflow.com/questions/34840366/matplotlib-pcolor-get-array-returns-flattened-array-how-to-get-2d-data-ba
        '''

        x0,y0 = self.p1[0], self.p1[1]  # get user's selected coordinates
        x1,y1 = self.p2[0], self.p2[1]
        length = int( np.hypot(x1-x0, y1-y0) )
        x, y = np.linspace(x0, x1, length),   np.linspace(y0, y1, length)

        # Extract the values along the line with nearest-neighbor pixel value:
        # get temp. data from the pcolor plot
        zi = self.data[x.astype(np.int), y.astype(np.int)]
        # Extract the values along the line, using cubic interpolation:
        #import scipy.ndimage
        #zi = scipy.ndimage.map_coordinates(self.data, np.vstack((x,y)))

        # if plots exist, delete them:
        if self.markers != None:
            if isinstance(self.markers, list):
                self.markers[0].remove()
            else:
                self.markers.remove()
        if self.arrow != None:
            self.arrow.remove()

        # plot the endpoints
        self.markers = self.img.axes.plot([x0, x1], [y0, y1], 'wo')
        # plot an arrow:
        self.arrow = self.img.axes.annotate("",
                    xy=(x0, y0),    # start point
                    xycoords='data',
                    xytext=(x1, y1),    # end point
                    textcoords='data',
                    arrowprops=dict(
                        arrowstyle="<-",
                        connectionstyle="arc3",
                        color='white',
                        alpha=0.7,
                        linewidth=3
                        ),

                    )

        # plot the data along the line on provided `ax`:
        if self.line != None:
            self.line[0].remove()   # delete the plot
        self.line = self.ax.plot(zi)
    #end drawLineSlice()

#end class LineTrace


# load the data:
D = np.genfromtxt(DataFilePath, ...)
fig, ax1, ax2 = plt.subplots(nrows=2, ncols=1)

# plot the data
img = ax1.pcolormesh( np.arange( len(D[0,:]) ), np.arange(len(D[:,0])), D )

# register the event handler:
LnTr = LineSlice(img, ax2)    # args: the pcolor plot (img) & the axis to plot the values on (ax2)
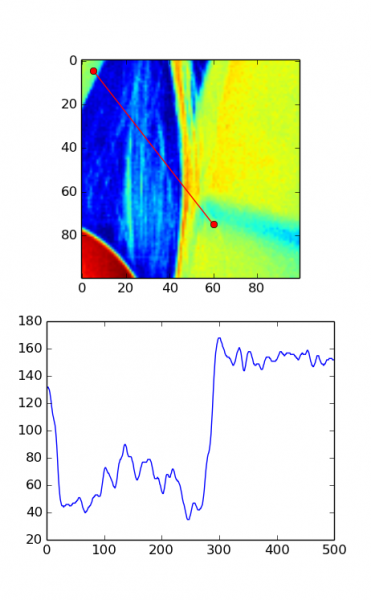
Daje to następujące rezultaty (po dodaniu etykiet osi itp.), po przeciągnięciu na wykres pcolor.:

Warning: date(): Invalid date.timezone value 'Europe/Kyiv', we selected the timezone 'UTC' for now. in /var/www/agent_stack/data/www/doraprojects.net/template/agent.layouts/content.php on line 54
2016-01-19 19:42:53